

UAE Sandstorms: Hidden Patterns Revealed in 50-Year Historical Data
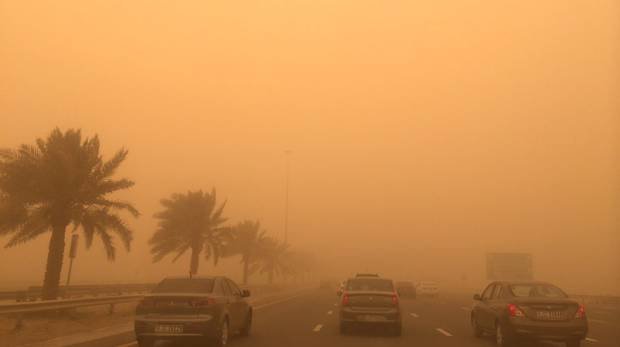
UAE sandstorms can cut visibility down to less than 3000 meters when winds blow harder than 15 knots. This visibility issue points to a worrying trend, as records show more mild to severe dust storms in the Emirates.
Data from a seven-year study reveals the UAE’s yearly visibility averaged between 8291 and 9295 meters, with typical sight distances around 8.98 kilometers[-3][-4][-5]. The situation gets worse in the central and northeastern regions of the country. Dubai faces these sandstorms often, but their strength changes based on the season and area. Local people call these dust events “shamal” storms, and they create big problems in daily life. Understanding these patterns is vital to create better solutions.
This piece looks at 50 years of data to reveal UAE sandstorms’ hidden patterns, their rise over time, and how they change with seasons. The research also shows how wind speed affects dust activity. On top of that, it shows how Dubai and other emirates have learned to deal with these tough weather conditions.
Understanding the Historical Dataset and Methodology
A complete analysis of UAE sandstorms needs reliable meteorological data. Scientists have used multiple sophisticated monitoring systems to track dust events across the Emirates in the last five decades.
Data Sources: MODIS, MISR, AERONET, and DS3505
Scientists mainly use four major data sources to study dust patterns. The Multi-angle Imaging SpectroRadiometer (MISR) captures tropospheric aerosol characteristics through nine view angles using Charge Coupled Devices (CCDs). The Moderate Resolution Imaging Spectroradiometer (MODIS), aboard Terra and Aqua satellites, provides nearly daily Earth coverage across 36 wavelength bands with spatial resolutions ranging from 250m to 1000m. The Aerosol Robotic Network (AERONET) delivers ground-based remote sensing data through its network of over 700 global stations. The National Climatic Data Center (NCDC) Climate Data website offers the DS3505 datasets that became the foundation for many UAE dust studies.
Visibility Classification: Severe, Dust Storm, Blowing Dust
Scientists created a standardized classification system based on horizontal visibility measurements. This system groups dust events into four distinct levels: Severe Dust Storm (visibility less than 200m), Dust Storm (visibility between 200m and 1000m), Blowing Dust (visibility between 1000m and 11,000m), and None (visibility exceeding 11,000m). These classifications help meteorologists calculate the intensity of sand events objectively and monitor their changes throughout UAE’s regions.
Timeframe and Station Coverage: 1970–2020
The dataset covers fifty years from 1970 to 2020 and offers an unprecedented view of long-term dust patterns. Eight international airports across the UAE collected data that ensured complete geographical coverage. This timespan helps scientists identify cyclical patterns and gradual changes in dust storm frequency and intensity. Scientists processed hourly visibility data into Excel files from 2010-2017 and created pivot tables to retrieve visibility events by category, years, and seasons.
The results revealed concerning findings: UAE’s average annual PM2.5 concentration measured eight times higher than WHO-established upper limits (5 µg/m³). Sandstorms contribute to this issue, but industrial emissions (mainly fossil fuels) and road transportation remain the main contributors to decreasing air quality in the region.
How Sandstorms Have Evolved Over 50 Years
Historical data shows dramatic changes in UAE sandstorms in the last fifty years. Long-term records give us vital insights into how these dramatic weather events have changed throughout the Emirates.
Decadal Shifts in Dust Storm Frequency
Historical records show clear decade-by-decade changes in UAE dust events. Between 1983-2014, dust episodes showed an upward trend at every monitoring station. The yearly increases were 0.20 in Abu Dhabi, 0.025 in Dubai, 0.16 in Sharjah, and 0.20 in Ras Al Khaimah. Abu Dhabi saw its highest number of dust episodes in 2007.
The records highlight distinct phases. A high-frequency period lasted from 1983-1992, and a low-frequency phase followed from 1994-1999. The data splits into three decades. The first period (1983-1993) had very high dust occurrence compared to later decades, except in Ras Al Khaimah. The second decade (1994-2004) showed much lower rates. Dust storm frequency increased by a lot at all stations in the third decade (2005-2014).
Visibility Reduction Trends in Central Emirates
Visibility records have shown a concerning decline since 2010. The UAE’s yearly visibility averaged between 8291 and 9295 meters, with a seven-year average of 8.98 kilometers. These numbers don’t tell the whole story of regional differences. The central and northeastern parts of the UAE experienced the most visibility reduction. Winter months brought worse visibility specifically to Abu Dhabi and other central Emirates.
Long-term trend analysis confirms this worsening situation. Abu Dhabi’s yearly dust events jumped from about 112.5 before 1999 to 337 after 1999. Dubai saw a similar rise from roughly 85.5 to 315.6 events.
Urban Development’s Effect on Dust Events
Urban development and dust events create an interesting paradox. Cities might increase pollution, but they also reduce the chance of dust emission. This complex relationship shows up in changing patterns throughout the Emirates.
The environment plays a key role too. Temperature data reveals a steady increase of about 0.065°C yearly since 1983 across UAE stations. This led to an overall rise of about 2.08K over 32 years. Higher temperatures relate to more dust events. They increase surface evaporation, reduce rain, and create drier soil conditions that favor dust storms.
Wind patterns strongly influence these events. During dust episodes, winds blow mainly from the southwest. This suggests dust moves from the Rub’ al Khali desert region into the UAE.
Hidden Patterns in Seasonal and Regional Dust Activity
Seasonal patterns significantly shape UAE’s sandstorm activity. Each emirate shows unique variations in how these storms behave. The data reveals some remarkable differences in where and when dust events occur.
Cluster Analysis of Seasonal Dust Events
Data analysis from UAE international airports between 2010-2017 revealed five distinct monthly dust storm patterns that show regional differences. PM10 levels reach their peak in summer months because of increased dust movement. This dust comes from the Sahara, Iran-Afghanistan border, and the Karakum desert. The powerful Shamal winds drive these seasonal changes and show up more often in summer. These winds connect closely to dust events across the Gulf region.
Why Fujairah and Ras Al Khaimah Deviate from the Norm
Dust patterns in Fujairah and Ras Al Khaimah look quite different from other central emirates. Ras Al Khaimah has seen massive dust devils that look like tornadoes. These landspouts form as thunderstorms develop but don’t match true tornadoes in strength or duration. Weather experts point out that these events are “different from a tornado and not classified as a dangerous weather phenomenon”. Fujairah stays protected from many inland dust events because of its coastal location and experiences its own unique weather patterns.
How Does Dubai Deal with Sandstorms?
Dubai uses advanced systems to monitor and forecast sandstorms to reduce their effects. The city’s monitoring network helps authorities to “plan and take precautionary steps to minimize the adverse effects of sand storms”. Officials use forecasts to warn people early. They advise staying indoors when needed and prepare air and road traffic to avoid accidents. Solar power plants in Dubai follow special cleaning procedures after dust events to keep power generation running smoothly.
Linking Wind Speed, Climate Change, and Dust Sources

Image Source: ResearchGate
Wind speed significantly affects how often and how severe sandstorms become in the UAE. The relationship between weather conditions and local geography creates a complex pattern of interactions.
Wind Speed Thresholds and Visibility Drop-offs
Scientists have found that sand particles start moving when wind speeds reach 7.71 m/s. The visibility drops to less than 3.5 kilometers once winds hit 11 m/s (24 mph). Recent events showed visibility falling below 2,000 meters at both Ras Al Khaimah International Airport and Al Maktoum International Airport. Severe visibility problems typically occur when wind speeds reach 15.0 m/s in Abu Dhabi and 17.42 m/s in Dubai. These conditions usually happen with winds blowing from the northwest.
Source Attribution: Iraq, Iran, and Saudi Arabia
The UAE’s atmospheric dust comes from several regions. Iraqi sources contribute about 60% of the dust, while 25% comes from the Afghanistan-Pakistan-Iran border area. Saudi Arabia’s Empty Quarter adds the remaining 15%. Some major sand storms that affect the Arabian Peninsula start as far away as Libya. These storms first disrupt Egyptian maritime traffic before moving toward UAE, Qatar, and Oman. The Shamal winds blow from the northwest (270°-360°) and carry most of this dust.
Climate Oscillations and Dust Transport Pathways
Climate change has intensified water vapor “rivers” over Africa, which leads to more dust storms in the Middle East. African atmospheric rivers help create clouds that produce massive dust storms through cold outflows. The dust clouds move south at heights of 4 km. They eventually sink to ground level when they reach the southern Arabian Peninsula.
Five decades of UAE sandstorm data show patterns that help explain this environmental phenomenon. The data gives a complete picture of how dust storms have changed in frequency and intensity since the 1970s. Scientists noticed major increases in Abu Dhabi, Dubai, Sharjah, and Ras Al Khaimah. Visual ranges dropped below 9 kilometers in central and northeastern regions during recent measurements.
Summer months see the highest dust activity because of powerful Shamal winds. This is a vital factor in understanding the patterns. Coastal areas like Fujairah show different dust patterns compared to inland emirates. Wind speed plays a key role – sand particles start moving at speeds of 7.7 m/s. When speeds go beyond 15 m/s, visibility drops below 3000 meters.
The UAE’s dust comes mainly from Iraqi territories, the Afghanistan-Pakistan-Iran border, and Saudi Arabia’s Empty Quarter. These regional climate patterns shape the frequency of storms. Climate change makes things more complex. Atmospheric water vapor “rivers” over Africa have become stronger and create more dust storms throughout the Middle East.
Dubai and other emirates use advanced monitoring systems and forecasting technologies to tackle these challenges. Local authorities can now warn people quickly and take protective steps during severe dust events. In spite of that, dust storms happen more often now. This creates ongoing problems for infrastructure, health systems, and daily life in the Emirates.
This 50-year study gives valuable lessons for future planning. UAE authorities can now learn about historical patterns to reduce the effects of dust events. Sandstorms will always be part of life in the Arabian Peninsula. Scientists keep studying their behavior to help create better solutions to this ongoing environmental challenge.